New NCERT Ganita Manjari · Class 9 Maths · Part II · Chapter 10: How Quantities Combine: Understanding Data
This chapter shows how averages combine when groups of different sizes are put together. It covers mixtures and concentration, the weighted mean, and how to add or remove a value from a mean. It also compares cluster, stacked and 100% stacked bar charts and what we can infer from them.
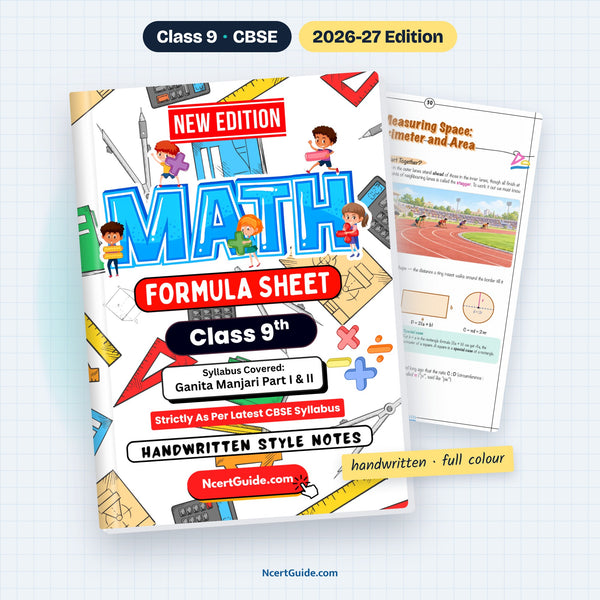
From the Class 9 Maths Formula Sheet, made as per the new NCERT book Ganita Manjari · Pages 50–53 of the book.
Key points
- The average (mean) tells us the centre of the data: Sum = Average × Number of values.
- Do not simply average two averages; use the group sizes.
- An average of averages works only when all groups have the same size.
- In a mixture, each concentration pulls the final answer towards itself in proportion to the quantity it contributes.
- When different substances are mixed, each one gets diluted by the total quantity.
- In a weighted mean, the weights show how important or how big each value is; with equal weights it equals the ordinary mean.
- The weighted mean always lies between the smallest and the largest value, and is closer to the value with the bigger weight.
- Multiplying all weights by the same number does not change the weighted mean, but adding the same number to all weights can.
- A cluster column chart compares each category; a stacked bar compares totals; a 100% stacked bar compares shares.
- You can make a 100% stacked bar chart from a stacked bar chart, but not the other way round, because the totals are lost.
- A 100% stacked bar compares shares, not actual numbers.
- Brahmagupta used the weighted mean to find the mean depth of an irregular pit; Śrīdharācārya used it for the purity of gold alloys.
Formulas
| Average (mean) | x̄ = Sum of all values ÷ Number of values Sum = Average × Number of values |
| Combined average of two groups | (an + bm)/(n + m) a, b = averages; n, m = sizes |
| Combined average of three groups | x̄ = (ap + bq + cr)/(p + q + r) |
| Concentration of a mixture | quantity of the substance in the mixture ÷ total quantity of the mixture × 100% |
| Weighted mean | x̄ = (w₁x₁ + w₂x₂ + … + wₙxₙ)/(w₁ + w₂ + … + wₙ) |
| New mean after adding x | [n × (old mean) + x]/(n + 1) |
| New mean after removing x | [n × (old mean) − x]/(n − 1) |
| Percentage share | part ÷ total × 100 |
Diagrams to learn
- Mixing 500 mL and 200 mL of lemonade, with weighted-mean number line
- Cluster column chart, stacked bar chart and 100% stacked bar chart of electricity use
- Table comparing chart types
- 100% stacked bar of flowers blooming in each season
- Table of useful facts about the weighted mean
- Wrong: averaging two group averages directly. Right: multiply each average by its group size, add, and divide by the total size.
- Different substances in a mixture both get diluted: 600 mL of 5% salt mixed with 300 mL of 8% sugar gives about 3.33% salt and 2.67% sugar.
- From a 100% stacked bar you cannot compare actual numbers between groups, because the totals are unknown.
A real page from the book

Get the full chapter in the book
This page is a summary. The Class 9 Maths Formula Sheet has the complete chapter in colour, with every diagram and worked example.
Frequently asked questions
How do you find the combined average of two groups?
If group 1 has n values with average a and group 2 has m values with average b, the combined average is (an + bm)/(n + m).
What is the formula for weighted mean?
Weighted mean = (w₁x₁ + w₂x₂ + … + wₙxₙ)/(w₁ + w₂ + … + wₙ), where w₁, w₂, … are the weights of the values x₁, x₂, ….
When should a 100% stacked bar chart be used?
Use it to compare proportions or percentages inside each group, since every bar has the same length. It hides the actual numbers and totals.
← Part II · Chapter 9: Propositions and their ConversesPart II · Chapter 11: The World of Algorithms →